
About this Article
- Authors: Taesung Kim, Cheonbok Park, Jinhee Kim, Jang-Ho Choi, Yunwon Tae, Jaegul Choo
- Journal: Proceedings of the International Conference on Learning Representations (ICLR)
- Year: 2022
- Official Citation: Kim, T., Park, C., Kim, J., Choi, J., Tae, Y., & Choo, J. (2022). Reversible Instance Normalization for Accurate Time-Series Forecasting Against Distribution Shift. In International Conference on Learning Representations.
Accomplishments
- Devised RevIN normalization method, alleviated mean and variance shifting problem in time-series forecasting.
Key Points
1. Idea
In time series data, mean and variance(both are non-stationary information) can be changed as time goes on. This is called as ‘distribution shift problem’, which is one of the most significant problem of performance enhancing. To alleviate this problem, authors suggested very simple idea. Just remove (normalize) input data and restore the information in output.
2. Steps
RevIN is symmetrical. Normalize and denormalize. It works like encoder(normalization) and decoder(denormalization) at the first and the last of existing NN. As RevIN is a method that adds layers at the very beginning and the very end, it can be applied to almost any NN.
- 1. Normalization
Normalize the input data using its mean and variance.
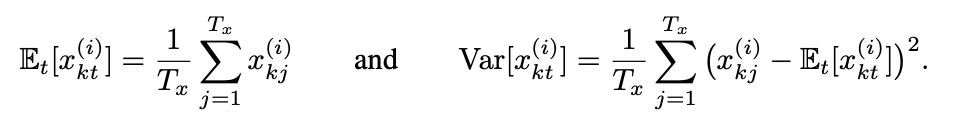
The formula looks complex, but it is just about computing average and variance.
Input is transformed by using the above two terms.
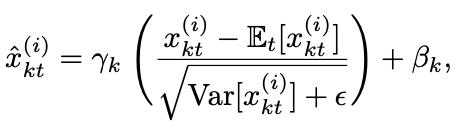
$\gamma$, $\beta$: learnable affine parameter vectors
-
2. Forecast Future As the non-stationary features are removed in normalization, normalized sequence is more consistent. Make a prediction by using the data.
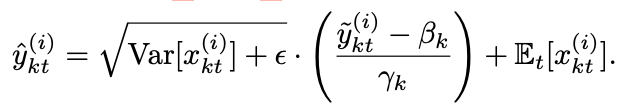
- 3. Denormalization
As the prediction of step 2 is far from original distribution, restore it by adding mean and variance information. Just reverse the step 1.
Figures & Table Explanation
1. Figure 1: Performance of RevIN-included model
RevIN-included model is closer to the ground truth.
2. Figure 3: Effect of normalization and denormalization by RevIN to distribution.
(a) Before applying normalization, train and test set had different distributions (discrepancy) over time. (b) After RevIN-normalized, two sets had similar distribution. (c), (d) At the end, non-stationary information were added.
3. Table 1, Table 2, Figure 4: Performance comparison of RevIN.
Table 1 shows that RevIN-included models are better with four datasets. In each datasets, the length of input sequence varied, and RevIN-included were better at long sequence predictions.
When the length of input sequence was fixed in 48, RevIN-included models were better at forecasting long sequences (Table 2).
Figure 4 shows that as time steps grows the MSE error explodes in RevIN-not-included models. However, RevIN-included ones were stable.
4. Table 3: Comparison of RevIN to other normalization methods.
RevIN was the lowest MSE error, and it is the best both in the performance and the number of parameters(only 2K are needed).
5. Figure 5: Feature divergence alleviation of RevIN.
Feature divergence is a difference of statistical distribution of features which are created inside the model layers. High feature divergence of train and test set means that the model recognizes the two sets are totally different. By using Revln, feature divergence decreased across train and test set.
댓글남기기